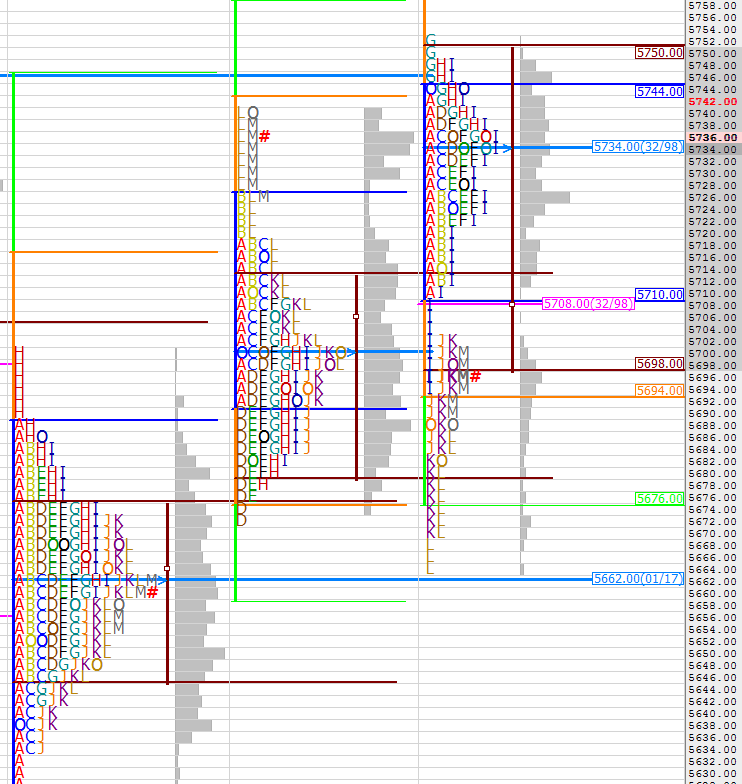
Today while studying Nifty Future chart ,observed something interesting ..that after Expiry, first session of new series the move is generally continuation of earlier direction but on the second or third day there is Reversal !!!
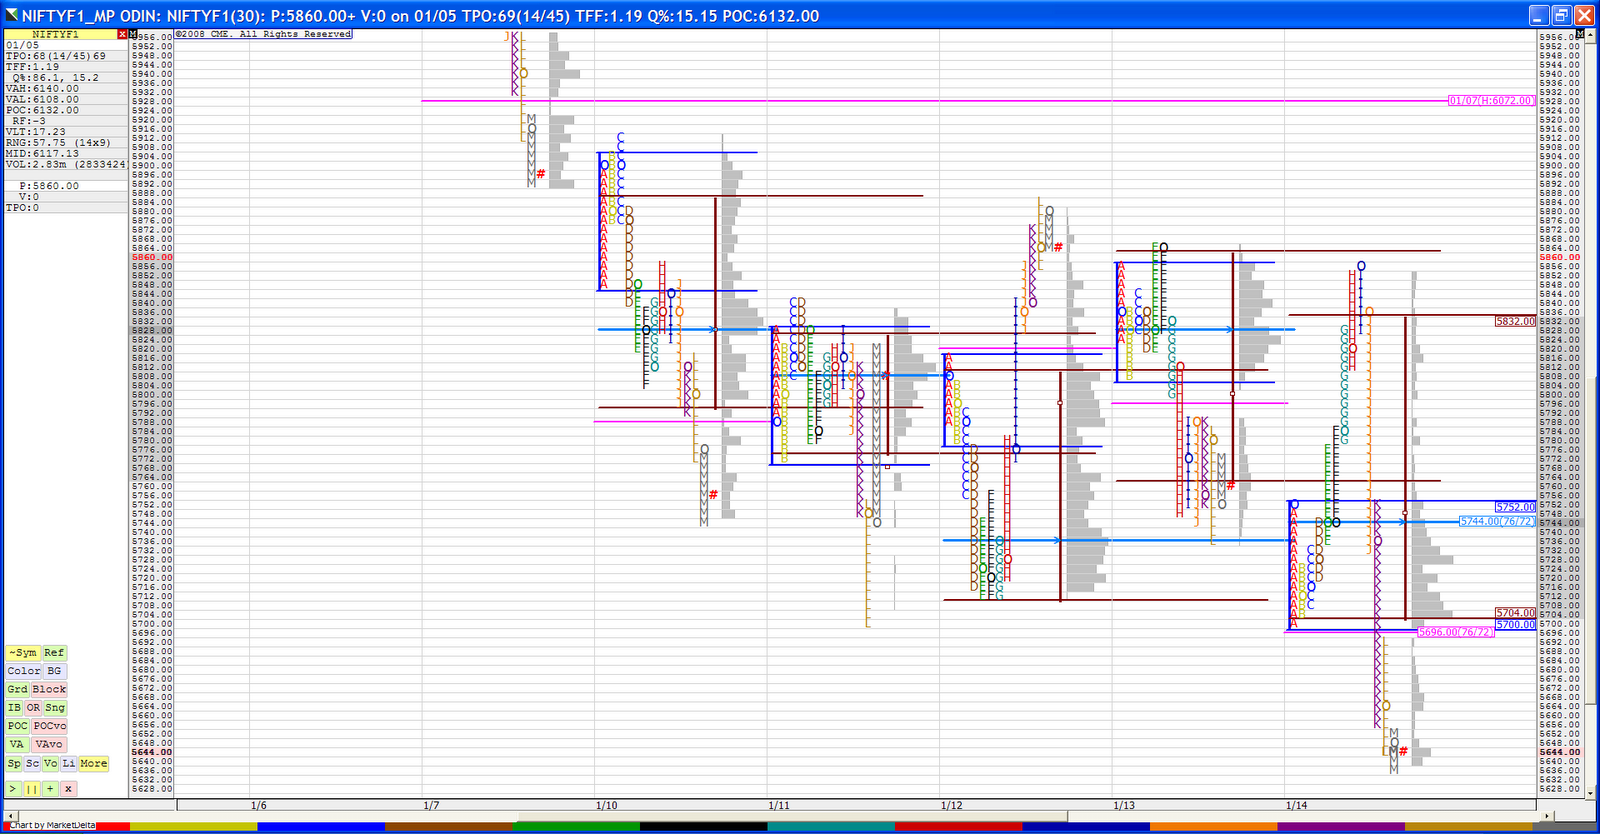
On chart i have pointed expiry days from to Sept 2010 to Jan 2011..in all occasions NF continued its direction on first session but reversed from next 1-2days.. :D
It can be coincidence, or may be not ..who knows ??
Here im not predicting or forecasting anything but only sharing what i have observed on charts..